The basis of the technique is very simple: a polymer layer over the test surface is swollen to equilibrium by soaking in an appropriate solvent (the swelling agent). As the solvent is removed by the fluid flow of interest, the polymer layer will shrink back, and for an initial period of time, known as the constant rate period, the local rate of recession of the polymer surface will be a direct measure of the local mass transfer coefficient.
Such a method has several advantages over ones based on the sublimation of a solid such as naphthalene. The test surface can be prepared for the next run simply by being put back in the soaking bath for a few hours rather than having to be re-cast, and a range of swelling agents of differing volatilities can be used to model different physical situations (analogous to changing the temperature) in both gases and liquids.
The surface recession can either be measured locally, say with a stylus or using moiré contouring, or as an averaged value from weighing the test piece before and after a run.
It is also possible to measure the surface recession by optical interferometric means such as holographic interferometry or Electronic Speckle Pattern Interferometry (ESPI). These are not only very sensitive (so that only small recessions are needed preventing the flow field from being affected by the changing shape of the test surface) but also provide directly results over the whole field of view. As the light and dark interference fringes represent contours of equal mass transfer coefficient, these methods also make it very easy to see what's going on.
Since live fringe interferometry is needed to determine absolute (rather than relative) fringe order it is desirable to make measurements with the test surface still in the flow field. There are two ways to do this: in the direct or front viewing method an opaque test surface is viewed through the fluid, whereas in the total internal reflection method the polymer surface is viewed from behind through a transparent object:
Clearly, the total internal reflection method requires the use of a transparent polymer. However, it has the advantage of separating the optical paths from the fluid, eliminating problems with woozing and wavering. For natural convection work it also has the advantage of making much more efficient use of the available laser illumination, allowing much shorter exposure times.
Here are some examples of the use of the swollen polymer technique coupled with holographic interferometry.
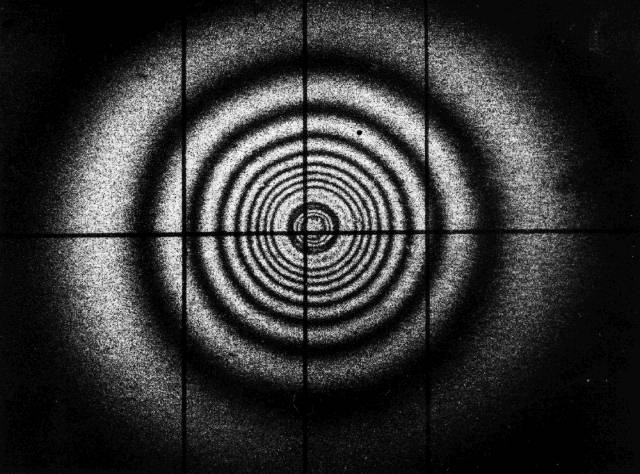
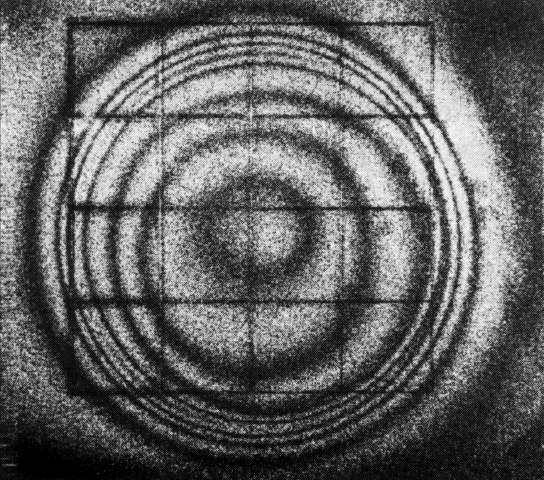
An air jet impinging normal to the surface is a convenient geometry for heat and mass transfer experimentation. Here is a frozen fringe interferogram produced with a round jet. Although it is easy to get an idea of the mass transfer coefficient distribution, it is impossible to see whether it has any local maxima or minima. This is not a problem when live fringe interferometry is used, as local maxima are seen as areas of fringe production.
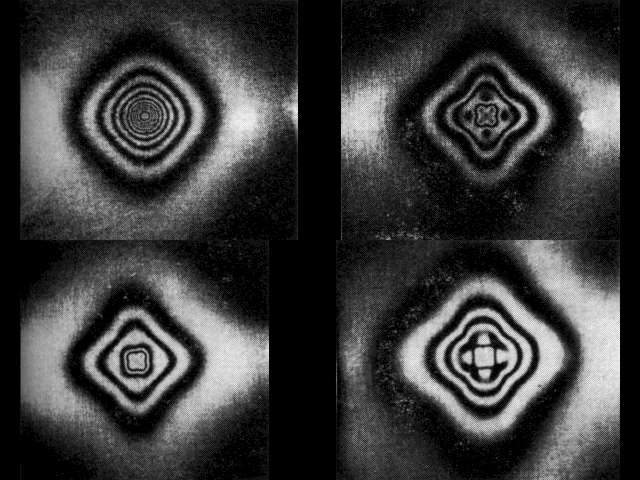
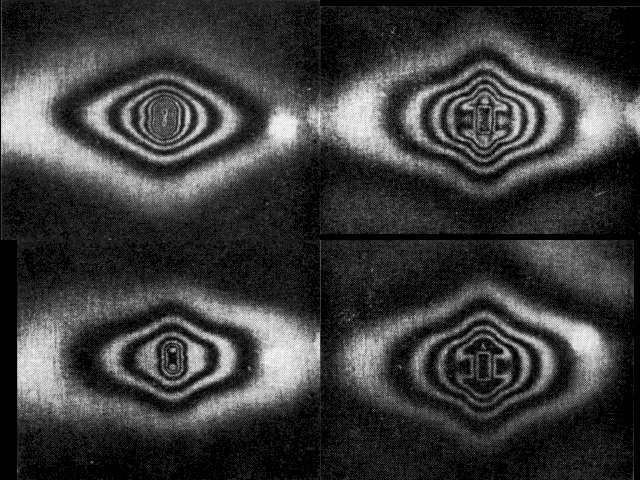
Masliyah and Nguyen have also looked at square (clockwise: Re = 1140, 3350, 7140, 2450) and rectangular (clockwise: Re = 1080, 5810, 7780, 2680) jets.
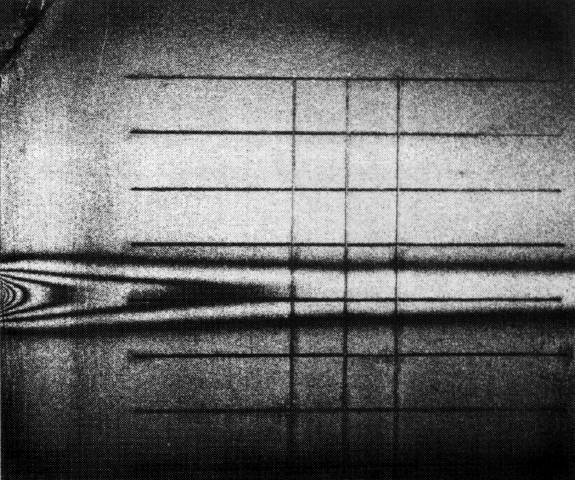
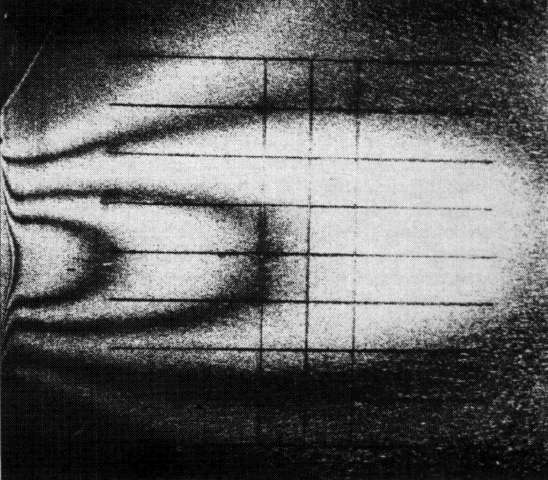
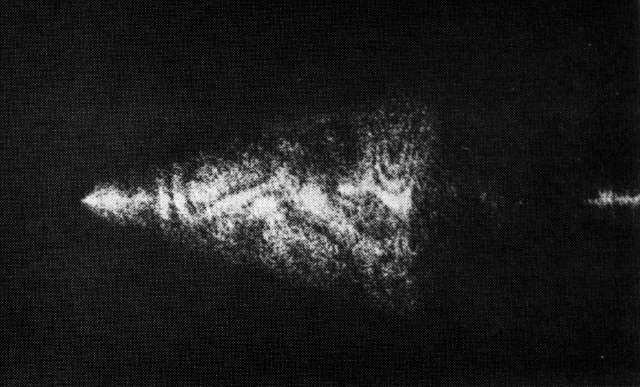
It is also possible to look at jets along the surface. Here are fringes caused by laminar and turbulent tangential jets (Kapur).
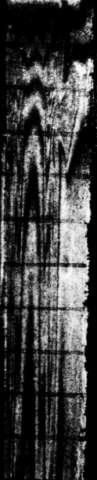
Larez has looked at water flows in rectangular ducts. The pictures have been resized from this shape.
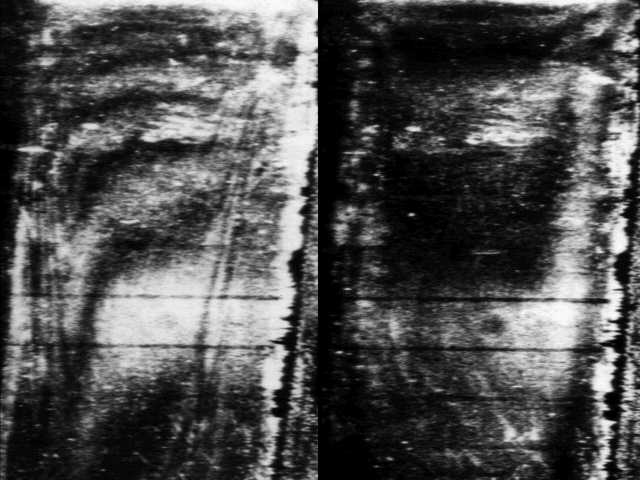
The first picture shows fringes obtained with a 2:1 ratio duct with only one transferring surface. The left hand image was taken with an abrupt entry at Re = 5815, and the right was taken with a calming section and Re = 3770.
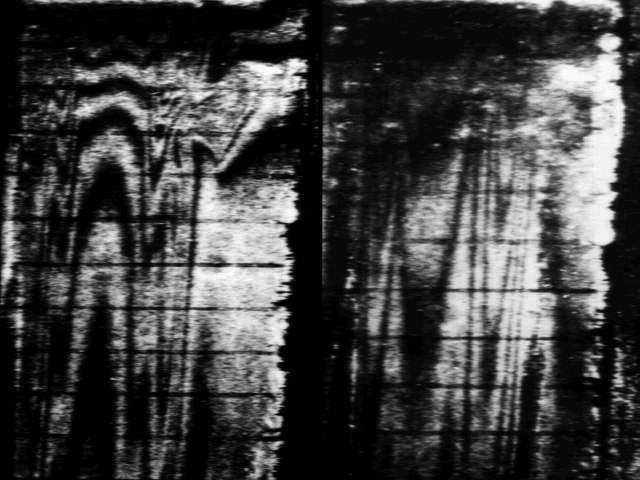
The second picture used 3:1 ratio ducts with symmetric transferring surfaces. The left side again had an abrupt entry and Re = 4770 whereas the right used a calming section and the flow had a Reynolds number of only 528.
Other applications of the swollen polymer technique have included a cone in a liquid flow and an unswollen plate held close to a rotating disc coated with swollen polymer (the fringes now represent take-up rather than loss of solvent).
There have been problems with applying the swollen polymer technique to natural convection, at least in air, as the volatile swelling agents needed tend to strip the polymer from the test surface.
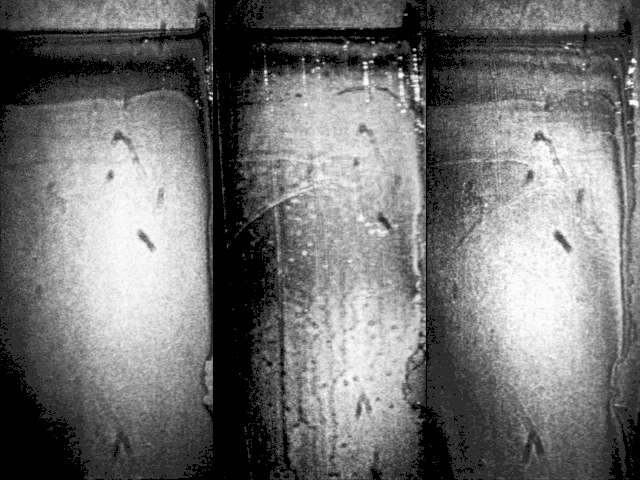
This problem has now been overcome. This picture shows double exposure interferograms of a vertical plate at intervals of 10, 20 and 50s. Fringes should be visible, appearing at the top of the polymer layer about 3/4 of the way up the picture and moving downwards (you may need to change the gamma correction on your viewer).